Overview
The Reports module provides organisers with detailed insights into event performance, ticket sales, revenue, and attendee data. Users can create custom reports, apply filters, schedule automated report delivery, and export reports for further analysis.
Accessing the Reports Module
Log in to the Ticmint Admin Dashboard.
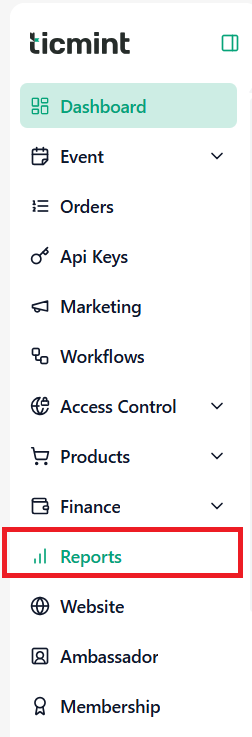
From the left-hand navigation menu, click Reports.
The Reporting Dashboard displays key analytics and report summaries.
Viewing All Reports
Click View All Reports.
The Reports page displays all available reports for your organization and events.
Use the Search bar to quickly locate a report by its name.
Click + Add Report to create a new custom report.
Creating a New Report
Click + Add Report.
Enter the required report details.
Under Dimensions, select the data fields you want to group the report by from the dropdown list.
Under Metrics, select the values you want to measure (such as ticket sales, revenue, attendees, etc.).
Click Filter to apply filters and limit the report data based on your requirements.
Select the desired Date Range.
Click Create to generate the report.
Scheduling a Report
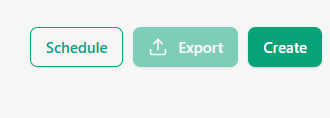
After creating the report, click Schedule to automatically send reports via email.
Configure the following settings:
Start Date
End Date
Schedule Type (Daily, Weekly, Monthly, etc.)
Report Time
Email Recipients
Cumulative Data
Enable Cumulative Data if you want each scheduled report to include data from the report’s start date up to the current reporting period.
This option is useful for tracking overall performance over time instead of viewing only the latest reporting period.
Once all details are entered, click Save.
Exporting Reports
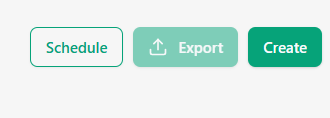
After creating the report, click the Export button.
Download the report in the available export format for offline analysis or sharing.
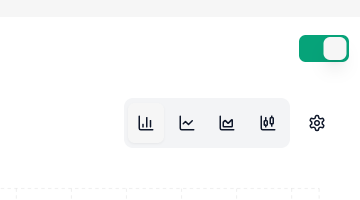
Changing the Report View
Open the created report.
Click the Settings icon.
Choose your preferred chart or graph type to visualize the report data.
Was this article helpful?
That’s Great!
Thank you for your feedback
Sorry! We couldn't be helpful
Thank you for your feedback
Feedback sent
We appreciate your effort and will try to fix the article